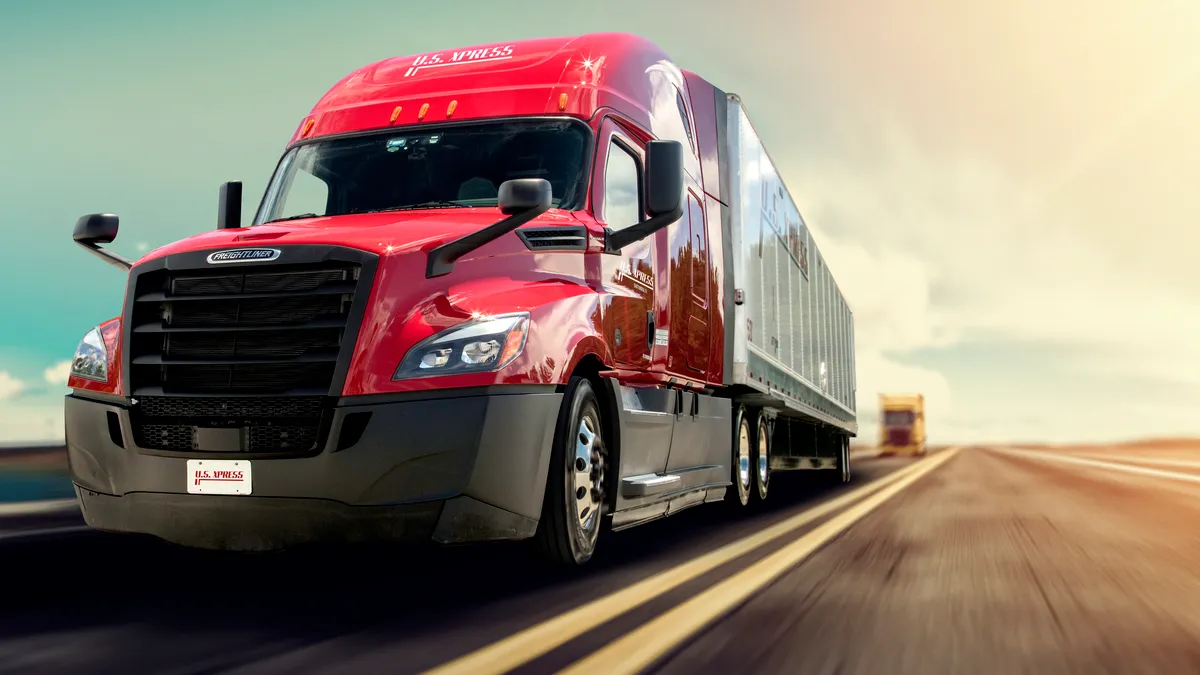
The business case was clear for U.S. Xpress to track asset utilization.
"It's the metric," said Cameron Ramsdell, president of Variant and U.S. Xpress OTR Solo. "When you look at the core drivers of financial performance, asset utilization is in the top three, right out of the gates."
Several large transport firms use the key performance indicator to track productivity. The more tractors and trailers in use, the more efficient and revenue-generating the fleet — and the better pitch it can make to drivers who earn pay based on distance driven rather than hours.
"In a per-mile world, utilization is key," Ramsdell said.
The question then for fleets is not whether to measure asset utilization but how to maximize it, particularly when the estimated industry average utilization is 50%.
The density game
Asset utilization is an overarching metric that encompasses several factors, which can include:
- Loaded miles per truck.
- Empty miles/deadheading compared to total miles driven.
- Dwell times.
- Trailers in use compared to trailers available.
- Tractors in use compared to tractors available.
- Trailer capacity in use compared to total capacity, especially for LTL.
- Hours utilized versus total working hours.
"Maybe a few drivers every day are driving 11 hours, but it's generally not happening," Ramsdell said, adding that U.S. Xpress aims for the "upper bounds" of nine to 10 hours of drive time per day.
Many factors outside of a fleet's control can also affect utilization, such as the market and available loads, delays at shipper and receiver facilities, labor shortages, traffic, and even a driver's flat tire.
"It's all about scale and density in this game."

Cameron Ramsdell
President of Variant and U.S. Xpress OTR Solo
That's why it's critical for fleets to optimize as many of the factors within their control, which means tapping into network density and route planning.
"It's about the relative proximity of each drop off to your next pickup," Ramsdell said. "It's all about scale and density in this game."
Some carriers, such as USA Truck, chose a regional model to improve density and utilization.
"We have found that [regional leaders] make better, more profitable and more consistent decisions than our previously centralized model could accomplish. Truly, it's a case of think globally, act locally," CEO James Reed said on USA Truck's Q3 earnings call in October.
In that earnings report, the carrier reported loaded miles per tractors increased by 14 miles, or 0.9%, over Q3 2019, and deadhead improved about 1% YoY, both of which Reed attributed to its regionalization strategy.

A treasure chest of data
Technology is another tool fleets are using to dynamically plan routes and increase fleet utilization.
Uber Freight touts its bundles feature as a way to cut down on empty miles. Drivers can book a load and a reload together to create a more efficient route. In July, Coyote Logistics launched dynamic route optimization that uses machine learning to build weekly route plans for fleets.
U.S. Xpress' digital fleet, known as Variant, is a key piece of the firm's work to improve utilization. Artificial intelligence and digital platforms manage, plan and dispatch the fleet.
The Variant fleet "is increasing the utilization and lowering the overall driver turnover," U.S. Xpress CEO Eric Fuller said on the company's Q3 earnings call in October, with initial results showing miles per week 20% higher compared to general over-the-road operations. The firm expects continued conversions from OTR to digital to "be supportive of modest sequential improvements in utilization," according to slides released with the Q3 earnings.

Fleets have access to a "treasure chest of data," Ramsdell said, from transactions to information feeding in from truck telematics devices.
The key is converting the data into insights to get the most out of assets, according to Stephen White, senior business development manager of Class 8 market at Geotab, a telematics company.
Geotab offers data-generated reports that "help unveil which vehicles are hardly used, overused or in downtime for maintenance or repair," White wrote in an email. The telematics provider's asset utilization report identifies the 10 most and 10 least utilized vehicles in a fleet.
"Even in a fully autonomous world, you're not getting 100%."

Cameron Ramsdell
President of Variant and U.S. Xpress OTR Solo
The Missouri Department of Transportation used Geotab's telematics platform to plan its routes strategically and maximize use of its fleets, according to White. The state agency has used asset tracking in response to winter snow storms.
"By monitoring the locations of their plow trucks, [the department] is able to respond to calls from local law enforcement and Highway Patrol quickly by dispatching the closest truck to the needed location," White said.
Dynamic routing by the second
Route planning is not one and done, particularly in a volatile pandemic when loads in one category spike while demand in another plummets. Uber Freight saw load bundling on its platform double in April and May, as essential goods transport spiked during the pandemic.
Ramsdell said U.S. Xpress is working on adjusting route plans several times per hour, sometimes as frequently as by the second, based on telematics data and market demand signals.
Even with the most advanced technology, the utopian 100% asset utilization is a far reach.
"Even in a fully autonomous world, you're not getting 100%," Ramsdell said. But that's not necessarily a bad thing, he said, and what's important is predicting deviations, being ready to respond to them in near real time, and being comfortable with a certain degree of chaos inherent in the transport world.
"That's just the nature of trucking," Ramsdell said. "Things happen."


